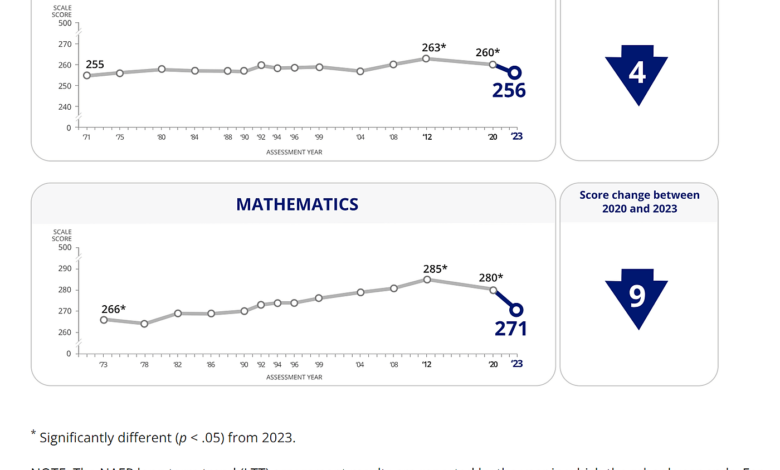
Today we received the latest National Assessment of Educational Progress (NAEP) Long‐Term Trend results, this time for 13‐year‐olds in math and reading. And as you can see below, they are not good, with scores dropping precipitously.
The COVID-19 disruption almost certainly had a lot to do with the plunge from 2020 to 2023, but the drop between 2012 and 2020 is harder to attribute to COVID. The 2020 testing was conducted from January to March of that year, so maybe the tail end saw some COVID effect, but probably little if any.
So why have scores been dropping since 2012?
Here’s where it becomes hard to determine causes from just NAEP results. It is likely, as I discussed when NAEP U.S. history and civics results came out, that the No Child Left Behind Act and its focus on standardized tests boosted scores between the act’s start in 2004 and 2012, perhaps in part by gearing schools much more toward standardized testing generally. NCLB was replaced by the less test‐centric Every Student Succeeds Act in 2015, which is, of course, between 2012 and 2020, so the drop between 2012 and 2020 might reflect a real decline in math and reading acumen, a deemphasis on testing and testing strategies, both, neither, and maybe a whole lot else.
Should we be alarmed? I think more than by the civics and U.S. history results, but not unduly. These are appreciable declines, and all other things equal, it’s preferable to see scores rise. These are also about basic skills. But as I’ve noted before, standardized test scores are not necessarily powerful predictors of important outcomes such as lifetime earnings and health.
A couple of other suggestive points are worth noting.
A major concern during COVID was that public schools were staying closed unnecessarily and hurting children. Less dire NAEP results for Roman Catholic schools, which tended to re‐open to in‐person instruction much faster than public schools, suggests that was a substantial problem. As seen in the charts below, between 2020 and 2023, Catholic schools (the only private schools with results that can be pinpointed) saw relatively small dips that were not statistically significant, meaning that we can be sure there was an actual decline in math and reading acumen rather than statistical chance resulting in lower scores.
This does not prove that COVID caused the huge score declines, or that Catholic schools are on average more effective than public – Catholic schools might have had more resilient families, their student composition could have changed between 2020 and 2023, and more – but it does bolster the case that public schools broadly dropped the ball, and families might have been better off with greater ability to choose private alternatives.
Finally, it’s worth noting what we’ve spent as we’ve gotten these results. The overall historical trend is basically flat after these losses, but total, inflation‐adjusted per‐pupil spending, as seen below, rose from $7,089 in the 1971–72 school year to $17,013 in 2019–20 (the latest available data), a 140 percent increase. Importantly, there is increasing evidence that spending can make a difference in outcomes, and many people value other things in education above standardized test results. So increased spending accompanying ultimately flat scores – especially with a pandemic toward the end – is not proof spending does not help. But it is hard to look at this as either supporting oft‐heard accusations that we are starving public schools, or that more money can simply be assumed to always produce higher test scores.
These results are bad news. But knowing why we got them is important, and we need more information for that.